
MIS Looks Healthy, But is the business really performing?


In the modern business landscape, understanding the nuances of Management Information Systems (MIS) and Business Diagnosis is essential for organizational growth and efficiency. Each plays a crucial role in enhancing business performance, but they serve different purposes and functions.
Why a Healthy MIS Can Hide a Weak Business?
MIS is like a scoreboard - it rarely explans whats driving the score. A business can grow while silently falling into risk, for example.
- Rise in revenue but selling price falls.
- Drop in unit margin with increase in revenue.
- Wrong Mix growth - high volume in low margin products.
That is why a move from reporting to diagnosis is required - so that decisions are based on drivers.

The MIS View - Our Business Case
The MIS dashboard showed
- Revenue increasing
- Quantity sold increasing
- Balanced regional spread
- Invoice count stable
From reporting lens : The business is growing. But it revealed only one question - "What happened".

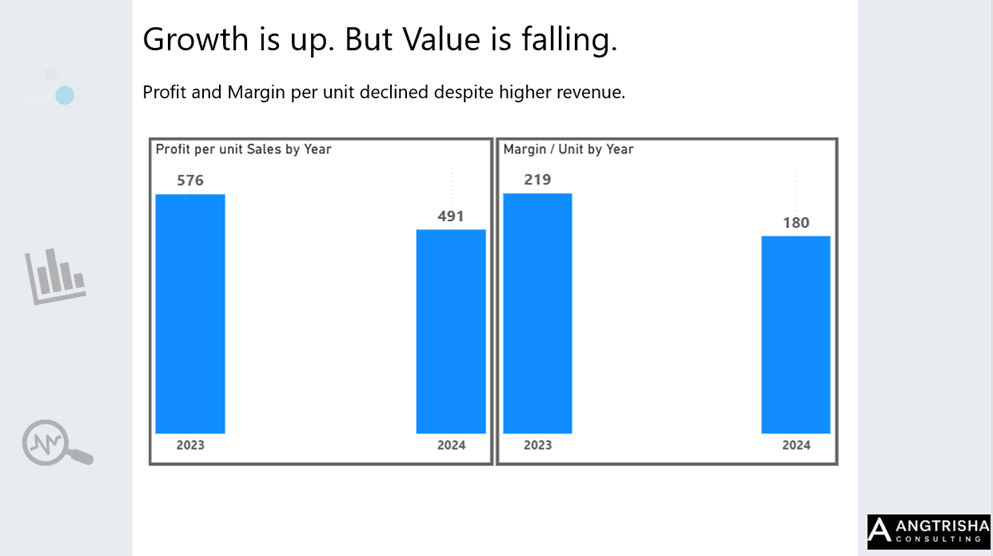
Diagnosis 1 : Growth was driven by volume not by value
At first glance revenue and volume were growing but a deeper look showed average selling price, margin per unit declined, indicating growth came at a cost of value.
Diagnosis 2 : Margins did n't fall. It shifted
In this case, margin movement was driven by three distinct forces:
- Volume effect - Higher sales quantity helped marginally
- Mix effect - Changes in product mix altered contribution
- Price effect - Reductions in selling price had the largest negative impact.
This distinction is critical.
Because reacting to a “margin drop” without understanding what caused it often leads to the wrong corrective actions.
Margin bridge showing how price erosion dominated overall margin movement.

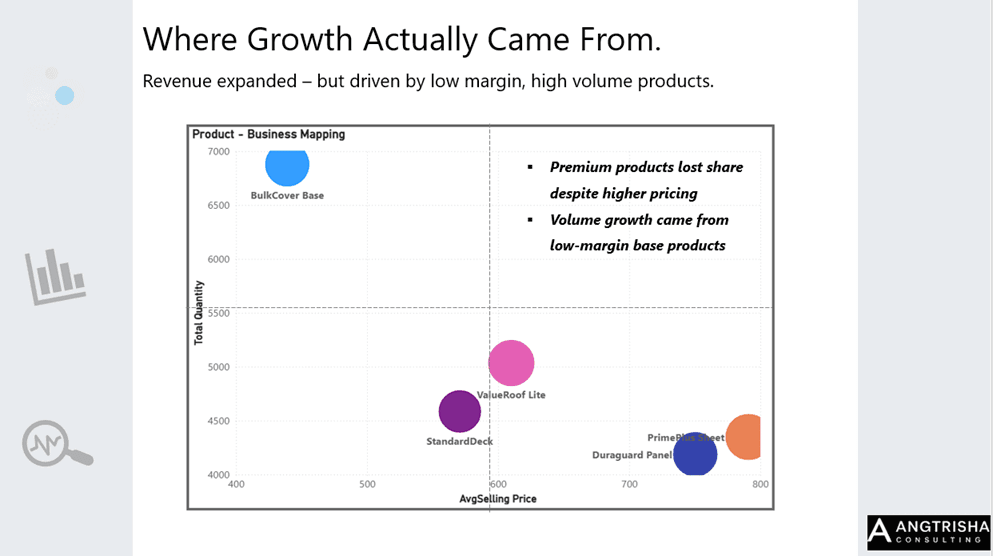
Diagnosis 3 : Analyzing Growth
At an aggregate level, growth looked healthy.
But when performance was decomposed at the product level, a different picture emerged.
The analysis showed a clear contribution shift.
- Low priced, base products expanded in volume
- High value, premium products lost margin contribution
- Overall growth was supported by quantity, not value
This type of shift is rarely visible in standard MIS views, because totals mask the quality of contribution across products.
Without diagnosing this mix change, leadership risks reinforcing the very behaviors that weaken long-term profitability.
Why MIS wasn't enough - AND Diagnostics was Necessary
The MIS was not wrong - it exactly reported what it is designed to do. But it could not explained why the outcomes changed
At an aggregate level
- Revenue increased
- Volume increased
- Business appeared stable
At a dignostic level
- Price erosion weakened margin
- Product mix shifted towards lower value product
- Growth was driven by quantity not by contribution
| MIS | Diagnostics |
|
|
Betterbusiness decisions does not come from more data but from better diagnosis.
From Reporting numbers to Diagnosing Performance
MIS will always remain essential. It provides structure, discipline, and visibility into outcomes.
Diagnostics looks beyond totals and asks deeper questions:
- What is really driving growth?
- Which decisions are weakening value?
- Where should leadership intervene — and where should it not?
This case illustrates how the same dataset can tell very different stories, depending on whether it is reported or diagnosed.
The difference is not the data.
The difference is the lens.